The Many Benefits of an HR Dashboard for Your SMB
Odds are you have an HR dashboard that offers insights into both the talent acquisition side of your human resources team’s efforts as well as the “people management” side of operations.
But, if this analytics setup isn’t “centralized” (i.e., built in a single platform), your HR managers will end up wasting time going back and forth between separate solutions to analyze important HR metrics.
Now, given you’re a small business, using an advanced business intelligence tool with countless intricate data visualizations and complex HR analytics dashboards likely isn’t worth the investment.
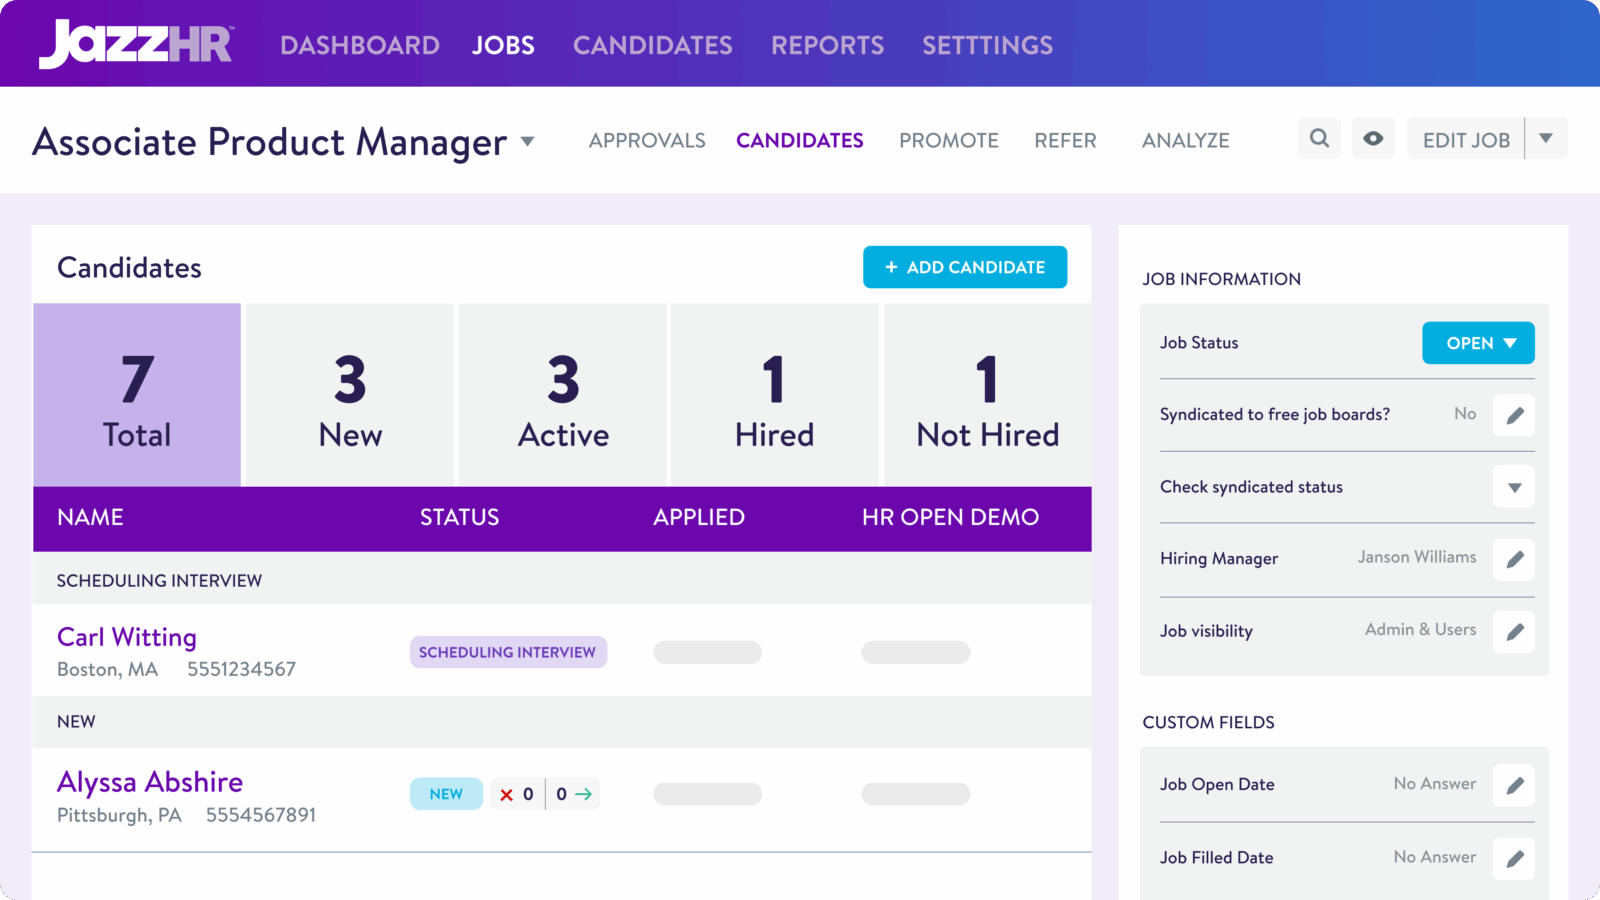
- What is worth allocating budget toward, though, is an applicant tracking system — one that can help your HR department get a real-time, holistic view of both recruiting activities as well as data tied to your workforce (e.g., employee engagement levels, voluntary attrition rate, performance reviews).
Not everyone on your HR team will need access to every facet of your HR dashboard. But, it’s nonetheless important to implement to ensure the appropriate human resources personnel at your SMB can easily access critical data sets that can help them in their day-to-day.
Setting up your HR dashboard with an ATS
Ideally, you would use an applicant tracking system (ATS) with built-in reporting capabilities to use as your primary HR dashboard. (If you have an HRIS/HCM system, it’s worth connecting that to your ATS to get a truly complete view of all HR data tied to candidates and employees).
At a basic level, your HR analytics software of choice should enable your HR professionals to:
- Seek and collect data from the business and employees, standardized by report
- Keep records of all hiring and employee data and aggregate that data in one place
- Access historical data so they can compare data sets and look for trends/patterns
It’s simple: Collect, aggregate, and compare. For example, to track employee churn rates, you might gather that info in a spreadsheet or translate those numbers into a graph.
By measuring changes over time, you can present the data to other key business stakeholders and inform decisions around both employee satisfaction and well-being as well as recruiting and hiring.
- To go a step further, apply key performance indicators (KPIs) to set goals for improvement.
Notably, regarding your talent acquisition efforts, you can set KPIs around sourcing quality, nurture engagement, interview speed, and hiring diverse candidates. (A dedicated diversity dashboard may even be needed to ensure you not only hire diverse talent but also empower them once hired.)
The point is constructing an HR metrics dashboard is critical to pre- and post-hire success. For the former, with your candidate outreach and conversion. For the latter, making progress with metrics including (but certainly not limited to) quality of hire and employee turnover and retention.
5 critical components of your HR dashboard
So, that’s how you create an HR dashboard — one both your HR executive(s) and generalists can benefit from. The next question is, what do you put on it? Start with these reporting areas.
1) Compliance
It’s incumbent on HR to ensure that every person and process company-wide is compliant.
With that in mind, you HR function will want to report on the number and severity of policy violations as well as KPIs on inclusive and diverse hiring and promotions. In many cases, regulatory bodies expect businesses to be tracking certain metrics in this area.
In short, this is essential to ensure your SMB complies with all relevant measures based on the types of workers you hire and where your org operates. (Note that even some cities and states have specific regulatory requirements, so factor those into your HR dashboard as well.)
2) Hiring Workflow
This report can be applied to any standard HR workflow or process, but is especially useful for hiring. You should track how many people are currently active in the hiring process, how quickly candidates move from “Applied” to “Interviewed” to “Hired,” and how/if people move from one funnel stage to the next (i.e., the conversion rate for each level of progression in your TA team’s talent pipeline).
3) Source vs. Quality of Hire
If you’re starting a new hiring phase or want to understand where your top talent comes from, this report is ideal. Organize it to view sources like referrals, recruiters, job boards, and more. Look at:
- Where past hires were sourced
- Who was involved in the process
- What roles people were hired for
Match that data against quality of hire (based on managers’ reviews of employees). It’s another useful report for your HR dashboard — and one your recruiters can even use to optimize their sourcing and interviewing efforts (that is, to ensure only quality candidates are advanced and eventually hired).
4) Process Tracking
How long do your HR processes take? Track start and end dates for projects, recruitment phases, onboarding, settling open issues, and so on. On top of this, you can identify and report on key stages throughout a process, like number of interviews vs. interview time.
5) Employee Information
Reports on employee metrics show how well individuals are performing, but can also be a key indicator for how well a business is supporting that performance. Consider including:
- Number of employees hired in X period
- Usage of time off/sickness leave
- Uptake of benefits
- Use of training resources
- 1-1 evaluation scores
- Wellbeing or NPS scores
- Engagement (such as number of logins on the company intranet or event attendance)
- Headcount and turnover rates
There are undoubtedly other types of employee details and data points to track, but start with these.
Using the right workforce analytics software
Building an HR dashboard might seem like a mammoth task. With the right data-gathering tools in place you can learn from a dynamic feed of info. What should you do with those learnings? Share the knowledge. Set ambitious goals. Use those insights every day to make incremental improvements.
Learn how JazzHR can help you make the most of your recruiting and hiring data and workforce analytics. Speak with our team today to get a custom demo of applicant tracking system for SMBs.


Leave a Reply
You must be logged in to post a comment.